










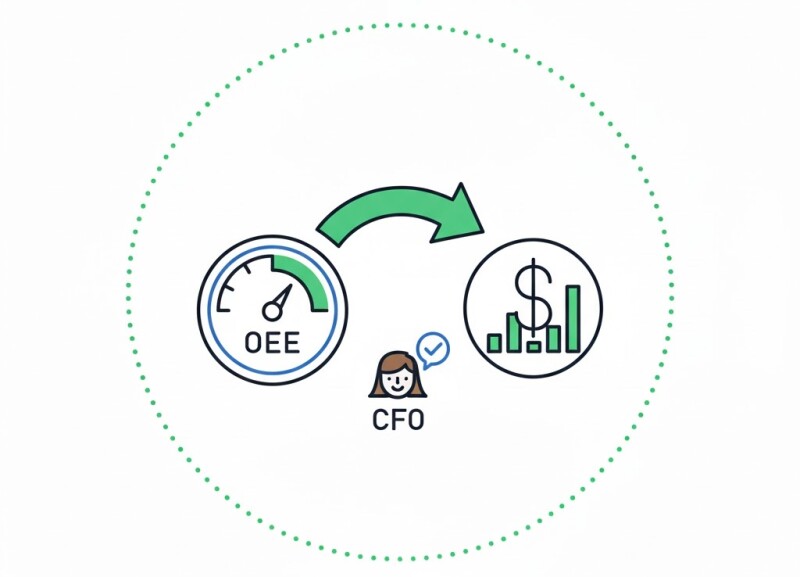
Tying OEE to Profit: A CFO-Friendly Guide
For many executives, OEE feels like a technical metric with unclear financial meaning. Translating equipment performance into profit impact bridges the gap between production and finance — and turns continuous improvement into a CFO’s ally.
From OEE to EBITDA
Every percentage point of OEE lost translates directly into capacity underutilization. By quantifying the cost of downtime, slow cycles, and rework, plants can express OEE losses in dollar terms.
OEE Financial Conversion Framework
- Calculate value per hour (sales / available time).
- Multiply by lost time due to downtime and performance losses.
- Subtract material and energy waste to get net lost margin.
Practical Example
A line producing $50k/hour with 78% OEE loses about $11k per hour of available capacity. Improving to 85% recovers over $4M annually in gross margin.
Dashboards for Executives
- Include both OEE (%) and “Value Lost” ($) on the same chart.
- Show trend lines vs budgeted output.
- Align with financial periods (shift → day → month).
Case Example: Food Manufacturer
By linking MES OEE data to ERP cost centers, finance teams visualized real-time profit leakage. The initiative funded itself within one quarter through scrap reduction alone.
Related Articles
- OEE That Drives Action: From Trend to Root Cause
- Changeover Reduction with Data: SMED Meets Analytics
- Run Rules: What to Alert On (and What to Ignore)
Conclusion
OEE is a business metric when tied to value. Expressing efficiency in financial terms aligns production and leadership — turning continuous improvement into measurable profit growth.






















Interested? Submit your enquiry using the form below:
Only available for registered users. Sign In to your account or register here.